服务器实现钉钉机器人报警
[TOC]
部署node_exporter
- 下载node_exporter安装包并解压
[root@VM-12-5-centos ~]# wget https://install.jishuliu.cn/prometheus/node_exporter-1.3.1.linux-amd64.tar.gz
--2023-06-26 14:43:38--  https://install.jishuliu.cn/prometheus/node_exporter-1.3.1.linux-amd64.tar.gz
Resolving package.jishuliu.cn (package.jishuliu.cn)... 61.170.65.58, 61.170.65.57, 2408:874e:1:2:51::, ...
Connecting to package.jishuliu.cn (package.jishuliu.cn)|61.170.65.58|:443... connected.
HTTP request sent, awaiting response... 200 OK
Length: 9033415 (8.6M) [application/gzip]
Saving to: ‘node_exporter-1.3.1.linux-amd64.tar.gz’

100%[====================================================================================================================================================================================================================================>] 9,033,415   8.66MB/s   in 1.0s

2023-06-26 14:43:39 (8.66 MB/s) - ‘node_exporter-1.3.1.linux-amd64.tar.gz’ saved [9033415/9033415]

[root@VM-12-5-centos ~]# tar xf node_exporter-1.3.1.linux-amd64.tar.gz -C /usr/local/
[root@VM-12-5-centos ~]# cd /usr/local/
[root@VM-12-5-centos local]# mv node_exporter-1.3.1.linux-amd64/ node_exporter- 添加node_exporter的系统监听文件
[root@VM-12-5-centos local]# vim /usr/lib/systemd/system/node_exporter.service

[Unit]
Description=node_exporter
After=syslog.target
After=network.target

[Service]
Type=simple
ExecStart=/usr/local/node_exporter/node_exporter
Restart=always
RestartSec=10
StartLimitInterval=100

[Install]
WantedBy=multi-user.target- 启动node_exporter并添加开机自启动
[root@VM-12-5-centos local]# service node_exporter start
Redirecting to /bin/systemctl start node_exporter.service
[root@VM-12-5-centos local]# service node_exporter status
Redirecting to /bin/systemctl status node_exporter.service
● node_exporter.service - node_exporter
   Loaded: loaded (/usr/lib/systemd/system/node_exporter.service; disabled; vendor preset: disabled)
   Active: active (running) since Mon 2023-06-26 14:45:35 CST; 3s ago
 Main PID: 12944 (node_exporter)
   CGroup: /system.slice/node_exporter.service
           └─12944 /usr/local/node_exporter/node_exporter

Jun 26 14:45:35 VM-12-5-centos node_exporter[12944]: ts=2023-06-26T06:45:35.391Z caller=node_exporter.go:115 level=info collector=thermal_zone
Jun 26 14:45:35 VM-12-5-centos node_exporter[12944]: ts=2023-06-26T06:45:35.391Z caller=node_exporter.go:115 level=info collector=time
Jun 26 14:45:35 VM-12-5-centos node_exporter[12944]: ts=2023-06-26T06:45:35.391Z caller=node_exporter.go:115 level=info collector=timex
Jun 26 14:45:35 VM-12-5-centos node_exporter[12944]: ts=2023-06-26T06:45:35.391Z caller=node_exporter.go:115 level=info collector=udp_queues
Jun 26 14:45:35 VM-12-5-centos node_exporter[12944]: ts=2023-06-26T06:45:35.391Z caller=node_exporter.go:115 level=info collector=uname
Jun 26 14:45:35 VM-12-5-centos node_exporter[12944]: ts=2023-06-26T06:45:35.391Z caller=node_exporter.go:115 level=info collector=vmstat
Jun 26 14:45:35 VM-12-5-centos node_exporter[12944]: ts=2023-06-26T06:45:35.391Z caller=node_exporter.go:115 level=info collector=xfs
Jun 26 14:45:35 VM-12-5-centos node_exporter[12944]: ts=2023-06-26T06:45:35.391Z caller=node_exporter.go:115 level=info collector=zfs
Jun 26 14:45:35 VM-12-5-centos node_exporter[12944]: ts=2023-06-26T06:45:35.391Z caller=node_exporter.go:199 level=info msg="Listening on" address=:9100
Jun 26 14:45:35 VM-12-5-centos node_exporter[12944]: ts=2023-06-26T06:45:35.392Z caller=tls_config.go:195 level=info msg="TLS is disabled." http2=false
[root@VM-12-5-centos local]# systemctl enable node_exporter.service
Created symlink from /etc/systemd/system/multi-user.target.wants/node_exporter.service to /usr/lib/systemd/system/node_exporter.service.
部署Prometheus
- 下载安装包并解压
[root@VM-12-5-centos ~]# wget "https://install.jishuliu.cn/prometheus/prometheus-2.32.1.linux-amd64.tar.gz"
--2023-06-26 14:29:31--  https://install.jishuliu.cn/prometheus/prometheus-2.32.1.linux-amd64.tar.gz
Resolving package.jishuliu.cn (package.jishuliu.cn)... 61.170.65.58, 61.170.65.57, 2408:8738:b000:d:40::b, ...
Connecting to package.jishuliu.cn (package.jishuliu.cn)|61.170.65.58|:443... connected.
HTTP request sent, awaiting response... 200 OK
Length: 75073989 (72M) [application/gzip]
Saving to: ‘prometheus-2.32.1.linux-amd64.tar.gz’

100%[====================================================================================================================================================================================================================================>] 75,073,989  4.33MB/s   in 15s

2023-06-26 14:29:47 (4.73 MB/s) - ‘prometheus-2.32.1.linux-amd64.tar.gz’ saved [75073989/75073989]

[root@VM-12-5-centos ~]# tar xf prometheus-2.32.1.linux-amd64.tar.gz -C /usr/local/
[root@VM-12-5-centos ~]# cd /usr/local/
[root@VM-12-5-centos local]# mv prometheus-2.32.1.linux-amd64/ prometheus- 创建Prometheus的系统服务文件
vim /etc/systemd/system/prometheus.service

[Unit]
Description=Prometheus
Documentation=https://prometheus.io/
After=network.target
[Service]
Type=simple
User=root
ExecStart=/usr/local/prometheus/prometheus --config.file=/usr/local/prometheus/prometheus.yml --storage.tsdb.path=/usr/local/prometheus/data
Restart=on-failure
[Install]
WantedBy=multi-user.target- 修改配置文件
[root@VM-12-5-centos prometheus]# vim prometheus.yml

# my global config
global:
  scrape_interval: 15s # Set the scrape interval to every 15 seconds. Default is every 1 minute.
  evaluation_interval: 15s # Evaluate rules every 15 seconds. The default is every 1 minute.
  # scrape_timeout is set to the global default (10s).

# Alertmanager configuration
alerting:
  alertmanagers:
    - static_configs:
        - targets: ["10.0.12.5:9093"] #alertmanager的IP:端口

# Load rules once and periodically evaluate them according to the global 'evaluation_interval'.
rule_files:
   - "rules.yml" #报警规则文件
  # - "second_rules.yml"

# A scrape configuration containing exactly one endpoint to scrape:
# Here it's Prometheus itself.
scrape_configs:
# The job name is added as a label `job=<job_name>` to any timeseries scraped from this config.
   - job_name: "测试环境服务器监控信息"
     static_configs:
- targets: ["10.0.12.5:9100"] #被监控服务器的node_exporter的IP:端口- 在Prometheus.yml的同级目录下创建rules.yml文件并写入以下内容
#组名
groups:
- name: 服务器监控
  #规则
  rules:
  #规则名
  - alert: 内存使用率告警-warring
    #获取服务器信息的语句
    expr: (node_memory_MemAvailable_bytes / node_memory_MemTotal_bytes * 100 < 20) * on(instance) group_left (nodename) node_uname_info{nodename=~".+"}
    #时间
    for: 1m
    labels:
      #报警级别
      severity: warning
    annotations:
      #报警的详情
      summary: 内存使用率大于80% (监控节点 {{ $labels.instance }})
      description: "内存使用大于(> 80% left)\n  当前值 = {{ $value }}\n"
  - alert: 磁盘读取速度监控
    expr: (sum by (instance) (rate(node_disk_read_bytes_total[2m])) / 1024 / 1024 > 50) * on(instance) group_left (nodename) node_uname_info{nodename=~".+"}
    for: 5m
    labels:
      severity: warning
    annotations:
      summary: 硬盘读取速度大于50MB/s (监控节点 {{ $labels.instance }})
      description: "硬盘读取速度 (> 50 MB/s)\n  当前值 = {{ $value }}\n"
  - alert: 磁盘写入速度监控
    expr: (sum by (instance) (rate(node_disk_written_bytes_total[2m])) / 1024 / 1024 > 50) * on(instance) group_left (nodename) node_uname_info{nodename=~".+"}
    for: 2m
    labels:
      severity: warning
    annotations:
      summary: 当前磁盘写入速度大于50MB/s (节点信息 {{ $labels.instance }})
      description: "硬盘写入速度 (> 50 MB/s)\n  当前值 = {{ $value }}\n"
  - alert: 硬盘空间监控
    expr: ((node_filesystem_avail_bytes * 100) / node_filesystem_size_bytes < 20 and ON (instance, device, mountpoint) node_filesystem_readonly == 0) * on(instance) group_left (nodename) node_uname_info{nodename=~".+"}
    for: 2m
    labels:
      severity: warning
    annotations:
      summary: 当前硬盘使用率大于70% (节点信息 {{ $labels.instance }})
      description: "硬盘剩余容量 (< 20% left)\n  当前值 = {{ $value }}\n"
  - alert: 服务器CPU负载
    expr: (sum by (instance) (avg by (mode, instance) (rate(node_cpu_seconds_total{mode!="idle"}[2m]))) > 0.8) * on(instance) group_left (nodename) node_uname_info{nodename=~".+"}
    for: 0m
    labels:
      severity: warning
    annotations:
      summary: 当前CPU负载大于80% (节点信息 {{ $labels.instance }})
      description: "CPU负载 > 80%\n  当前值 = {{ $value }}\n "
  - alert: 服务器接收数据网速
    expr: (sum by (instance) (rate(node_network_receive_bytes_total[2m])) / 1024 / 1024 > 100) * on(instance) group_left (nodename) node_uname_info{nodename=~".+"}
    for: 5m
    labels:
      severity: warning
    annotations:
      summary: 服务器接收数据网速大于100MB/s (节点信息 {{ $labels.instance }})
      description: "服务器接收数据网速 (> 100 MB/s)\n  VALUE = {{ $value }}\n  LABELS = {{ $labels }}"
  - alert: 服务器发送数据网速
    expr: (sum by (instance) (rate(node_network_transmit_bytes_total[2m])) / 1024 / 1024 > 100) * on(instance) group_left (nodename) node_uname_info{nodename=~".+"}
    for: 5m
    labels:
      severity: warning
    annotations:
      summary: 服务器发送数据网速大于100MB/s (节点信息 {{ $labels.instance }})
description: "服务器发送数据网速 (> 100 MB/s)\n VALUE = {{ $value }}\n LABELS = {{ $labels }}"- 创建Prometheus的data文件夹
[root@VM-12-5-centos ~]# cd /usr/local/prometheus/
[root@VM-12-5-centos prometheus]# mkdir data
[root@VM-12-5-centos prometheus]# ls
console_libraries consoles data LICENSE NOTICE prometheus prometheus.yml promtool rules.yml- 启动Prometheus并添加开机自启
[root@VM-12-5-centos prometheus]# service prometheus start
Redirecting to /bin/systemctl start prometheus.service
[root@VM-12-5-centos prometheus]# service prometheus status
Redirecting to /bin/systemctl status prometheus.service
● prometheus.service - Prometheus
   Loaded: loaded (/etc/systemd/system/prometheus.service; disabled; vendor preset: disabled)
   Active: active (running) since Mon 2023-06-26 14:51:58 CST; 4s ago
     Docs: https://prometheus.io/
 Main PID: 14677 (prometheus)
   CGroup: /system.slice/prometheus.service
           └─14677 /usr/local/prometheus/prometheus --config.file=/usr/local/prometheus/prometheus.yml --storage.tsdb.path=/usr/local/prometheus/data

Jun 26 14:51:59 VM-12-5-centos prometheus[14677]: ts=2023-06-26T06:51:59.032Z caller=head.go:522 level=info component=tsdb msg="On-disk memory mappable chunks replay completed" duration=5.601µs
Jun 26 14:51:59 VM-12-5-centos prometheus[14677]: ts=2023-06-26T06:51:59.032Z caller=head.go:528 level=info component=tsdb msg="Replaying WAL, this may take a while"
Jun 26 14:51:59 VM-12-5-centos prometheus[14677]: ts=2023-06-26T06:51:59.033Z caller=head.go:599 level=info component=tsdb msg="WAL segment loaded" segment=0 maxSegment=1
Jun 26 14:51:59 VM-12-5-centos prometheus[14677]: ts=2023-06-26T06:51:59.034Z caller=head.go:599 level=info component=tsdb msg="WAL segment loaded" segment=1 maxSegment=1
Jun 26 14:51:59 VM-12-5-centos prometheus[14677]: ts=2023-06-26T06:51:59.034Z caller=head.go:605 level=info component=tsdb msg="WAL replay completed" checkpoint_replay_duration=27.622µs wal_replay_duration=1.738589ms total_replay_duration=1.784945ms
Jun 26 14:51:59 VM-12-5-centos prometheus[14677]: ts=2023-06-26T06:51:59.035Z caller=main.go:945 level=info fs_type=EXT4_SUPER_MAGIC
Jun 26 14:51:59 VM-12-5-centos prometheus[14677]: ts=2023-06-26T06:51:59.035Z caller=main.go:948 level=info msg="TSDB started"
Jun 26 14:51:59 VM-12-5-centos prometheus[14677]: ts=2023-06-26T06:51:59.036Z caller=main.go:1129 level=info msg="Loading configuration file" filename=/usr/local/prometheus/prometheus.yml
Jun 26 14:51:59 VM-12-5-centos prometheus[14677]: ts=2023-06-26T06:51:59.040Z caller=main.go:1166 level=info msg="Completed loading of configuration file" filename=/usr/local/prometheus/prometheus.yml totalDuration=4.849125ms db_storage=861ns remote_storage=3.506µs w…ms
Jun 26 14:51:59 VM-12-5-centos prometheus[14677]: ts=2023-06-26T06:51:59.040Z caller=main.go:897 level=info msg="Server is ready to receive web requests."
Hint: Some lines were ellipsized, use -l to show in full.
[root@VM-12-5-centos prometheus]# systemctl enable prometheus.service
Created symlink from /etc/systemd/system/multi-user.target.wants/prometheus.service to /etc/systemd/system/prometheus.service.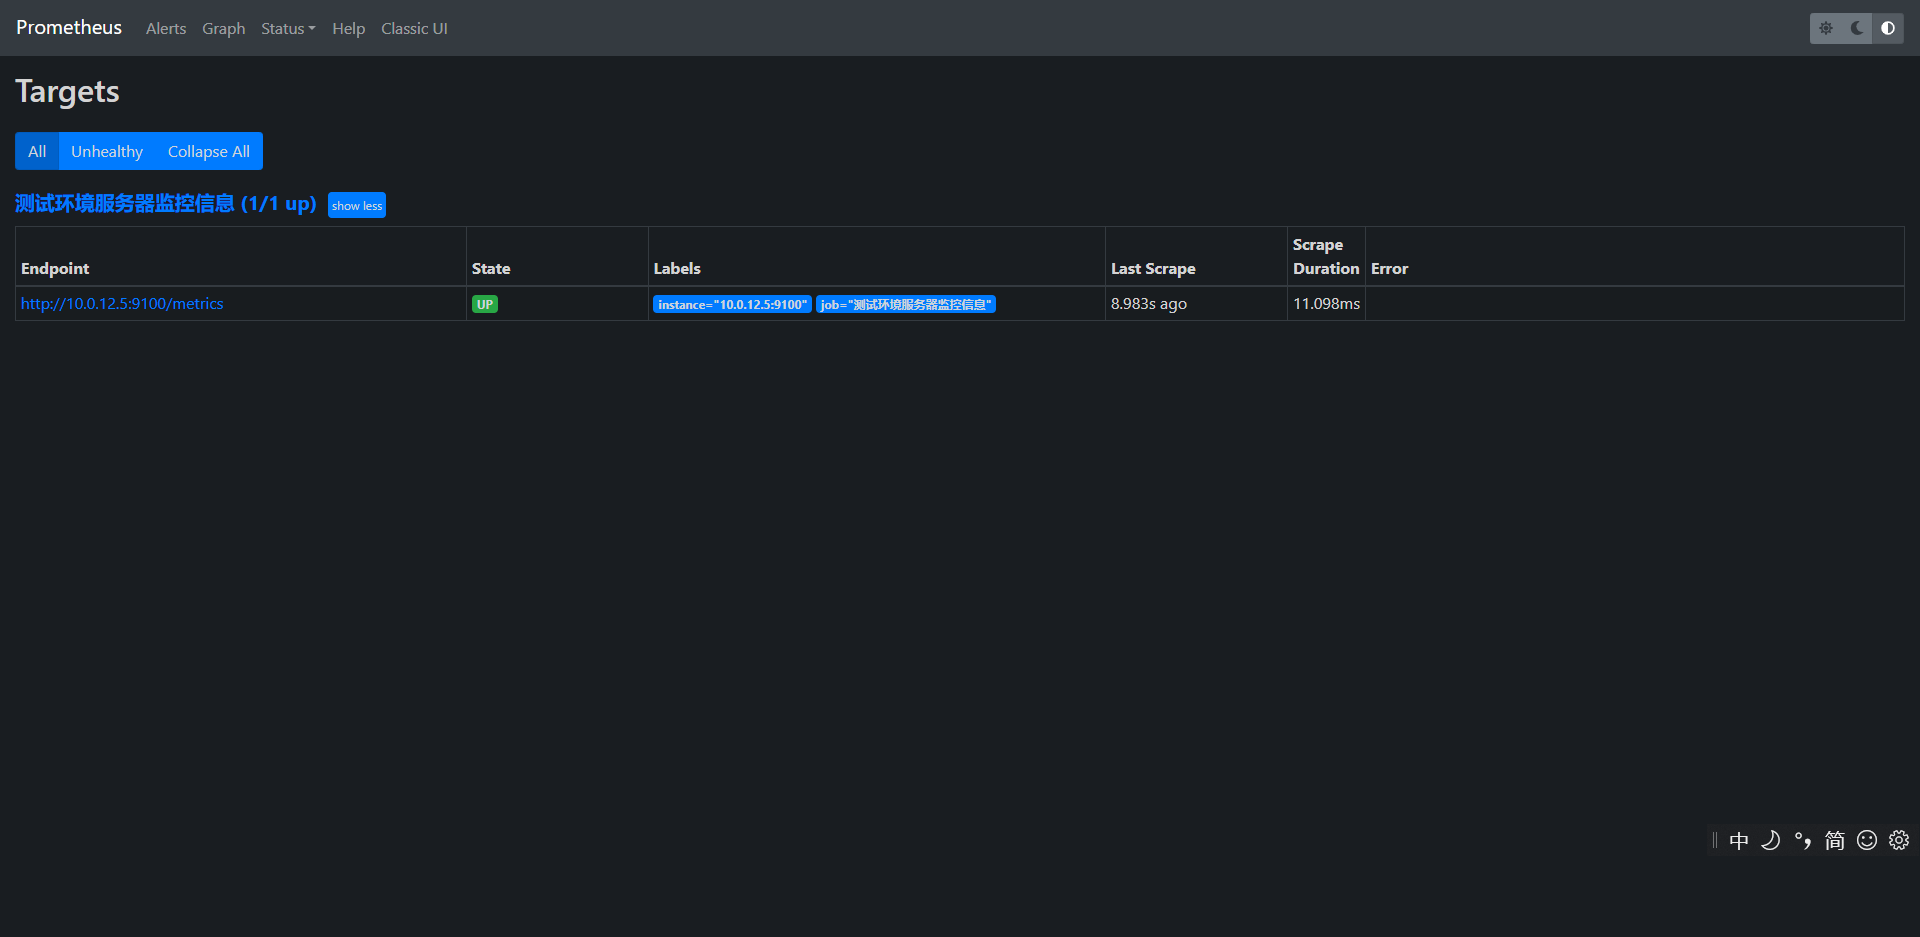
[root@VM-12-5-centos prometheus]# - 浏览器访问服务器的9090端口查看监控是否正常
部署alertmanager
- 下载并解压
[root@VM-12-5-centos ~]# wget https://install.jishuliu.cn/prometheus/alertmanager-0.25.0.linux-amd64.tar.gz
--2023-06-26 15:08:13--  https://install.jishuliu.cn/prometheus/alertmanager-0.25.0.linux-amd64.tar.gz
Resolving package.jishuliu.cn (package.jishuliu.cn)... 61.170.65.58, 61.170.66.189, 2408:874e:1:1:51::, ...
Connecting to package.jishuliu.cn (package.jishuliu.cn)|61.170.65.58|:443... connected.
HTTP request sent, awaiting response... 200 OK
Length: 29254678 (28M) [application/gzip]
Saving to: ‘alertmanager-0.25.0.linux-amd64.tar.gz’

100%[====================================================================================================================================================================================================================================>] 29,254,678  4.15MB/s   in 5.2s

2023-06-26 15:08:19 (5.35 MB/s) - ‘alertmanager-0.25.0.linux-amd64.tar.gz’ saved [29254678/29254678]

[root@VM-12-5-centos ~]# tar xf alertmanager-0.25.0.linux-amd64.tar.gz -C /usr/local/
[root@VM-12-5-centos ~]# cd /usr/local/
[root@VM-12-5-centos local]# mv alertmanager-0.25.0.linux-amd64/ alertmanager- 修改配置文件
global:
  resolve_timeout: 5m

route:
  # group_by:采用哪个标签作为分组的依据
  group_by: ['alertname', 'severity', 'namespace']
  group_wait: 10s #一组告警第一次发送之前等待的时间
  group_interval: 10s #一组已发送初始通知的告警接收到新告警后,再次发送通知前等待的时间
  repeat_interval: 1m #一条成功发送的告警,在再次发送通知之前等待的时间。
  receiver: 'dingding.webhook1' # 定义用那个通知报警渠道组
  #报警规则
  routes:
  - receiver: 'dingding.webhook1'
    match:
      team: test  #团队名
    group_wait: 10s #一组告警第一次发送之前等待的时间
    group_interval: 1m #一组已发送初始通知的告警接收到新告警后,再次发送通知前等待的时间
    repeat_interval: 3h #一条成功发送的告警,在再次发送通知之前等待的时间。

receivers:
- name: 'dingding.webhook1' # 报警渠道名
  webhook_configs:
  - url: 'http://10.0.12.5:8060/dingtalk/webhook1/send' #prometheus-webhook-dingtalk的地址
send_resolved: true- 创建alertmanager的系统服务文件并设置开机启动
[root@VM-12-5-centos alertmanager]# vim /etc/systemd/system/alertmanager.service

[Unit]
Description=alertmanager
Documentation=https://www.jishuliu.cn/
After=network.target
[Service]
Type=simple
User=root
ExecStart=/usr/local/alertmanager/alertmanager --config.file=/usr/local/alertmanager/alertmanager.yml
Restart=on-failure
[Install]
WantedBy=multi-user.target
[root@VM-12-5-centos alertmanager]# service alertmanager start
Redirecting to /bin/systemctl start alertmanager.service
[root@VM-12-5-centos alertmanager]# service alertmanager status
Redirecting to /bin/systemctl status alertmanager.service
● alertmanager.service - alertmanager
   Loaded: loaded (/etc/systemd/system/alertmanager.service; disabled; vendor preset: disabled)
   Active: active (running) since Mon 2023-06-26 15:21:54 CST; 2s ago
     Docs: https://www.jishuliu.cn/
 Main PID: 22888 (alertmanager)
   CGroup: /system.slice/alertmanager.service
           └─22888 /usr/local/alertmanager/alertmanager --config.file=/usr/local/alertmanager/alertmanager.yml

Jun 26 15:21:54 VM-12-5-centos systemd[1]: Started alertmanager.
Jun 26 15:21:54 VM-12-5-centos alertmanager[22888]: ts=2023-06-26T07:21:54.604Z caller=main.go:240 level=info msg="Starting Alertmanager" version="(version=0.25.0, branch=HEAD, revision=258fab7cdd551f2cf251ed0348f0ad7289aee789)"
Jun 26 15:21:54 VM-12-5-centos alertmanager[22888]: ts=2023-06-26T07:21:54.604Z caller=main.go:241 level=info build_context="(go=go1.19.4, user=root@abe866dd5717, date=20221222-14:51:36)"
Jun 26 15:21:54 VM-12-5-centos alertmanager[22888]: ts=2023-06-26T07:21:54.605Z caller=cluster.go:185 level=info component=cluster msg="setting advertise address explicitly" addr=10.0.12.5 port=9094
Jun 26 15:21:54 VM-12-5-centos alertmanager[22888]: ts=2023-06-26T07:21:54.606Z caller=cluster.go:681 level=info component=cluster msg="Waiting for gossip to settle..." interval=2s
Jun 26 15:21:54 VM-12-5-centos alertmanager[22888]: ts=2023-06-26T07:21:54.636Z caller=coordinator.go:113 level=info component=configuration msg="Loading configuration file" file=/usr/local/alertmanager/alertmanager.yml
Jun 26 15:21:54 VM-12-5-centos alertmanager[22888]: ts=2023-06-26T07:21:54.636Z caller=coordinator.go:126 level=info component=configuration msg="Completed loading of configuration file" file=/usr/local/alertmanager/alertmanager.yml
Jun 26 15:21:54 VM-12-5-centos alertmanager[22888]: ts=2023-06-26T07:21:54.640Z caller=tls_config.go:232 level=info msg="Listening on" address=[::]:9093
Jun 26 15:21:54 VM-12-5-centos alertmanager[22888]: ts=2023-06-26T07:21:54.640Z caller=tls_config.go:235 level=info msg="TLS is disabled." http2=false address=[::]:9093
Jun 26 15:21:56 VM-12-5-centos alertmanager[22888]: ts=2023-06-26T07:21:56.606Z caller=cluster.go:706 level=info component=cluster msg="gossip not settled" polls=0 before=0 now=1 elapsed=2.000163762s
[root@VM-12-5-centos alertmanager]# systemctl enable alertmanager.service
Created symlink from /etc/systemd/system/multi-user.target.wants/alertmanager.service to /etc/systemd/system/alertmanager.service.
[root@VM-12-5-centos alertmanager]#
部署Prometheus-webhook-dingtalk
- 下载并解压
[root@VM-12-5-centos ~]centos prometheus-webhook-dingtalk]# systemctl enable dingtalk.service
Created symlink from /etc/systemd/system/multi-user.target.wants/dingtalk.service to /etc/systemd/system/dingtalk.service.
[root@VM-12-5-centos prometheus-webhook-dingtalk]# service dingtalk start
Redirecting to /bin/systemctl start dingtalk.service
[root@VM-12-5-centos prometheus-webhook-dingtalk]# service dingtalk status
Redirecting to /bin/systemctl status dingtalk.service
● dingtalk.service - Prometheus
   Loaded: loaded (/etc/systemd/system/dingtalk.service; enabled; vendor preset: disabled)
   Active: active (running) since Mon 2023-06-26 15:55:34 CST; 2s ago
     Docs: https://prometheus.io/
 Main PID: 31282 (prometheus-webh)
   CGroup: /system.slice/dingtalk.service
           └─31282 /usr/local/prometheus-webhook-dingtalk/prometheus-webhook-dingtalk --web.enable-ui --config.file=/usr/local/prometheus-webhook-dingtalk/config.yml

Jun 26 15:55:34 VM-12-5-centos systemd[1]: Started Prometheus.
Jun 26 15:55:34 VM-12-5-centos prometheus-webhook-dingtalk[31282]: ts=2023-06-26T07:55:34.025Z caller=main.go:59 level=info msg="Starting prometheus-webhook-dingtalk" version="(version=2.1.0, branch=HEAD, revision=8580d1395f59490682fb2798136266bdb3005ab4)"
Jun 26 15:55:34 VM-12-5-centos prometheus-webhook-dingtalk[31282]: ts=2023-06-26T07:55:34.025Z caller=main.go:60 level=info msg="Build context" (gogo1.18.1,userroot@177bd003ba4d,date20220421-08:19:05)=(MISSING)
Jun 26 15:55:34 VM-12-5-centos prometheus-webhook-dingtalk[31282]: ts=2023-06-26T07:55:34.025Z caller=coordinator.go:83 level=info component=configuration file=/usr/local/prometheus-webhook-dingtalk/config.yml msg="Loading configuration file"
Jun 26 15:55:34 VM-12-5-centos prometheus-webhook-dingtalk[31282]: ts=2023-06-26T07:55:34.025Z caller=coordinator.go:91 level=info component=configuration file=/usr/local/prometheus-webhook-dingtalk/config.yml msg="Completed loading of configuration file"
Jun 26 15:55:34 VM-12-5-centos prometheus-webhook-dingtalk[31282]: ts=2023-06-26T07:55:34.025Z caller=main.go:97 level=info component=configuration msg="Loading templates" templates=test.tmpl
Jun 26 15:55:34 VM-12-5-centos prometheus-webhook-dingtalk[31282]: ts=2023-06-26T07:55:34.026Z caller=main.go:113 component=configuration msg="Webhook urls for prometheus alertmanager" urls=http://localhost:8060/dingtalk/webhook1/send
Jun 26 15:55:34 VM-12-5-centos prometheus-webhook-dingtalk[31282]: ts=2023-06-26T07:55:34.026Z caller=web.go:208 level=info component=web msg="Start listening for connections" address=:8060
修改Prometheus的监控规则文件
- 把"内存使用率告警-warring"的语句改为以下内容
#原来的
expr: (node_memory_MemAvailable_bytes / node_memory_MemTotal_bytes * 100 < 20) * on(instance) group_left (nodename) node_uname_info{nodename=~".+"}
#新的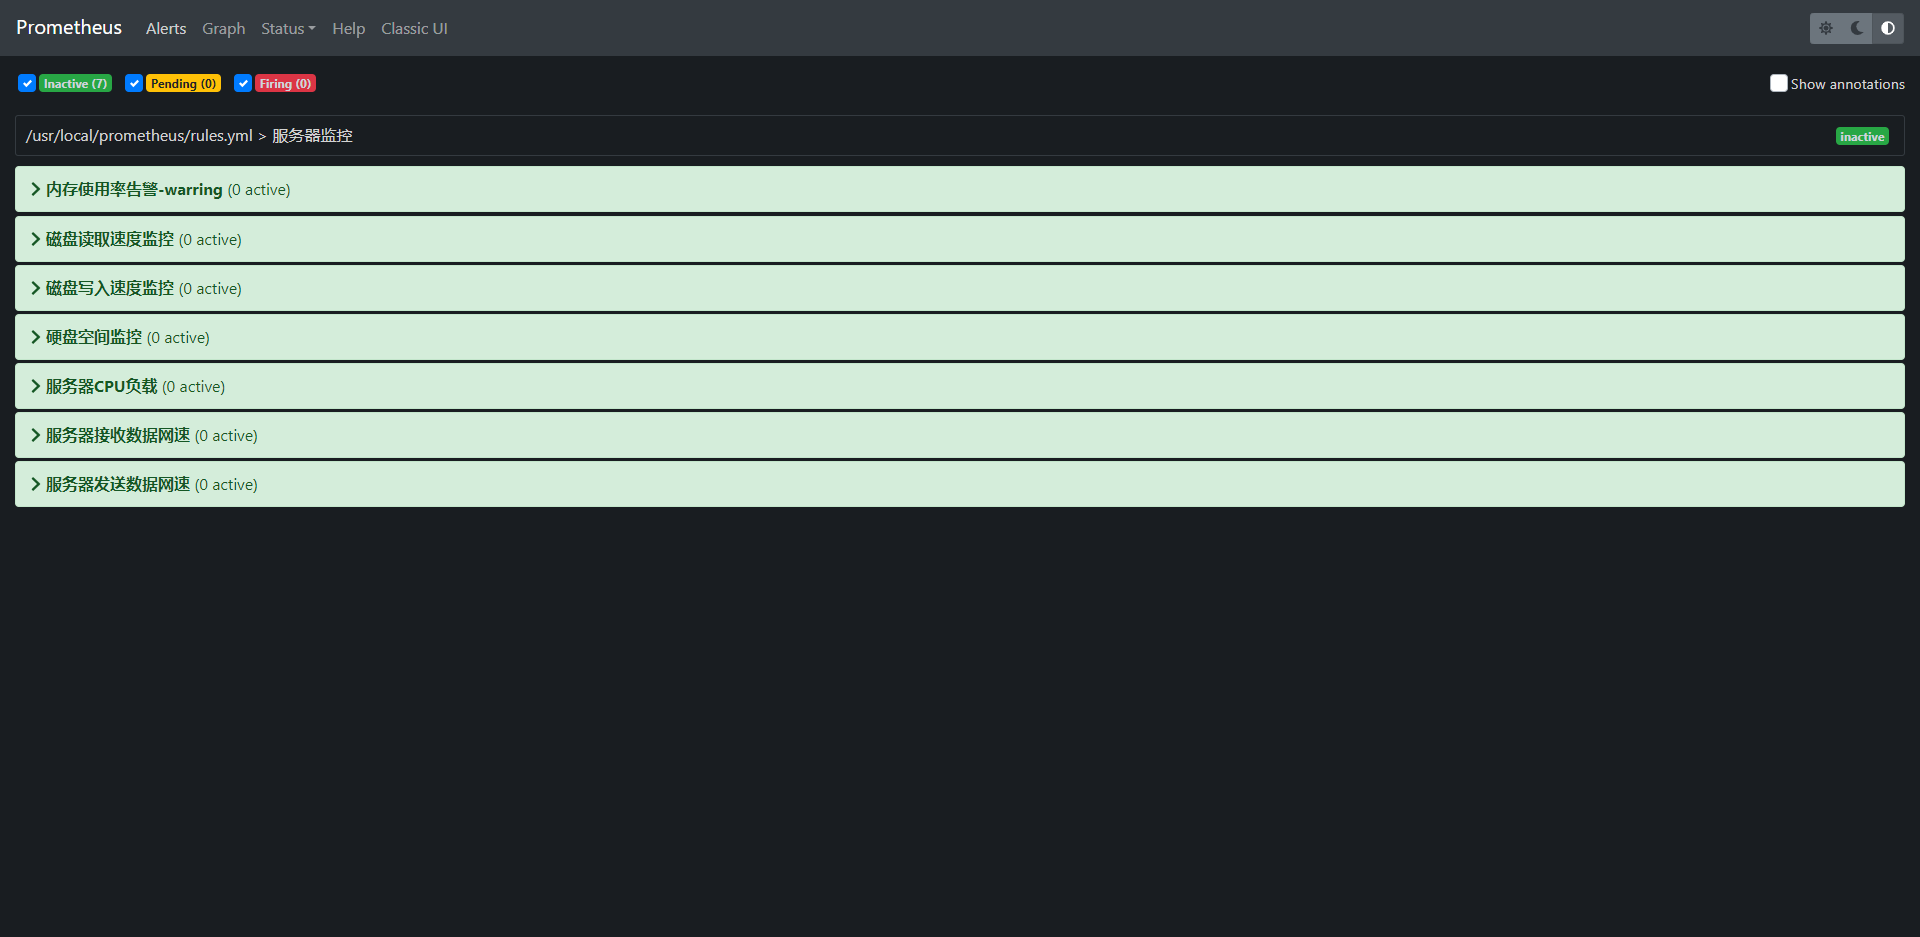
expr: (node_memory_MemAvailable_bytes / node_memory_MemTotal_bytes * 100 < 99) * on(instance) group_left (nodename) node_uname_info{nodename=~".+"}- 修改后重启Prometheus,再次查看Prometheus的报警页面
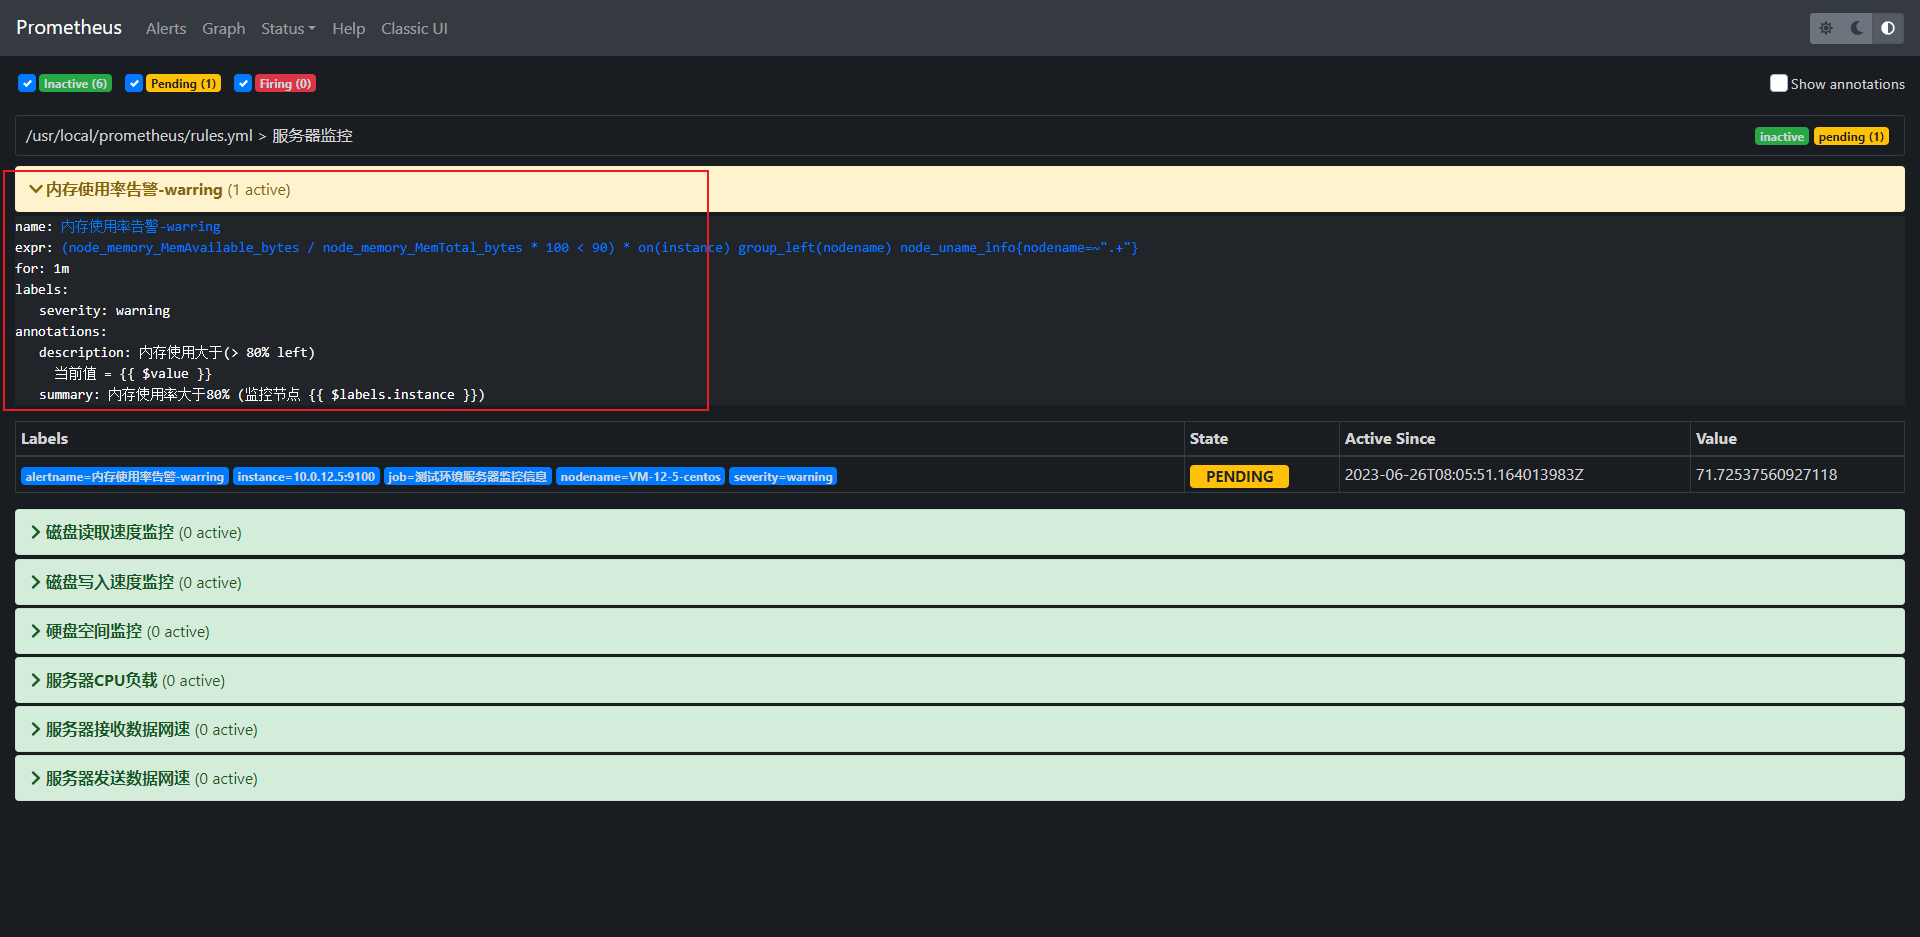
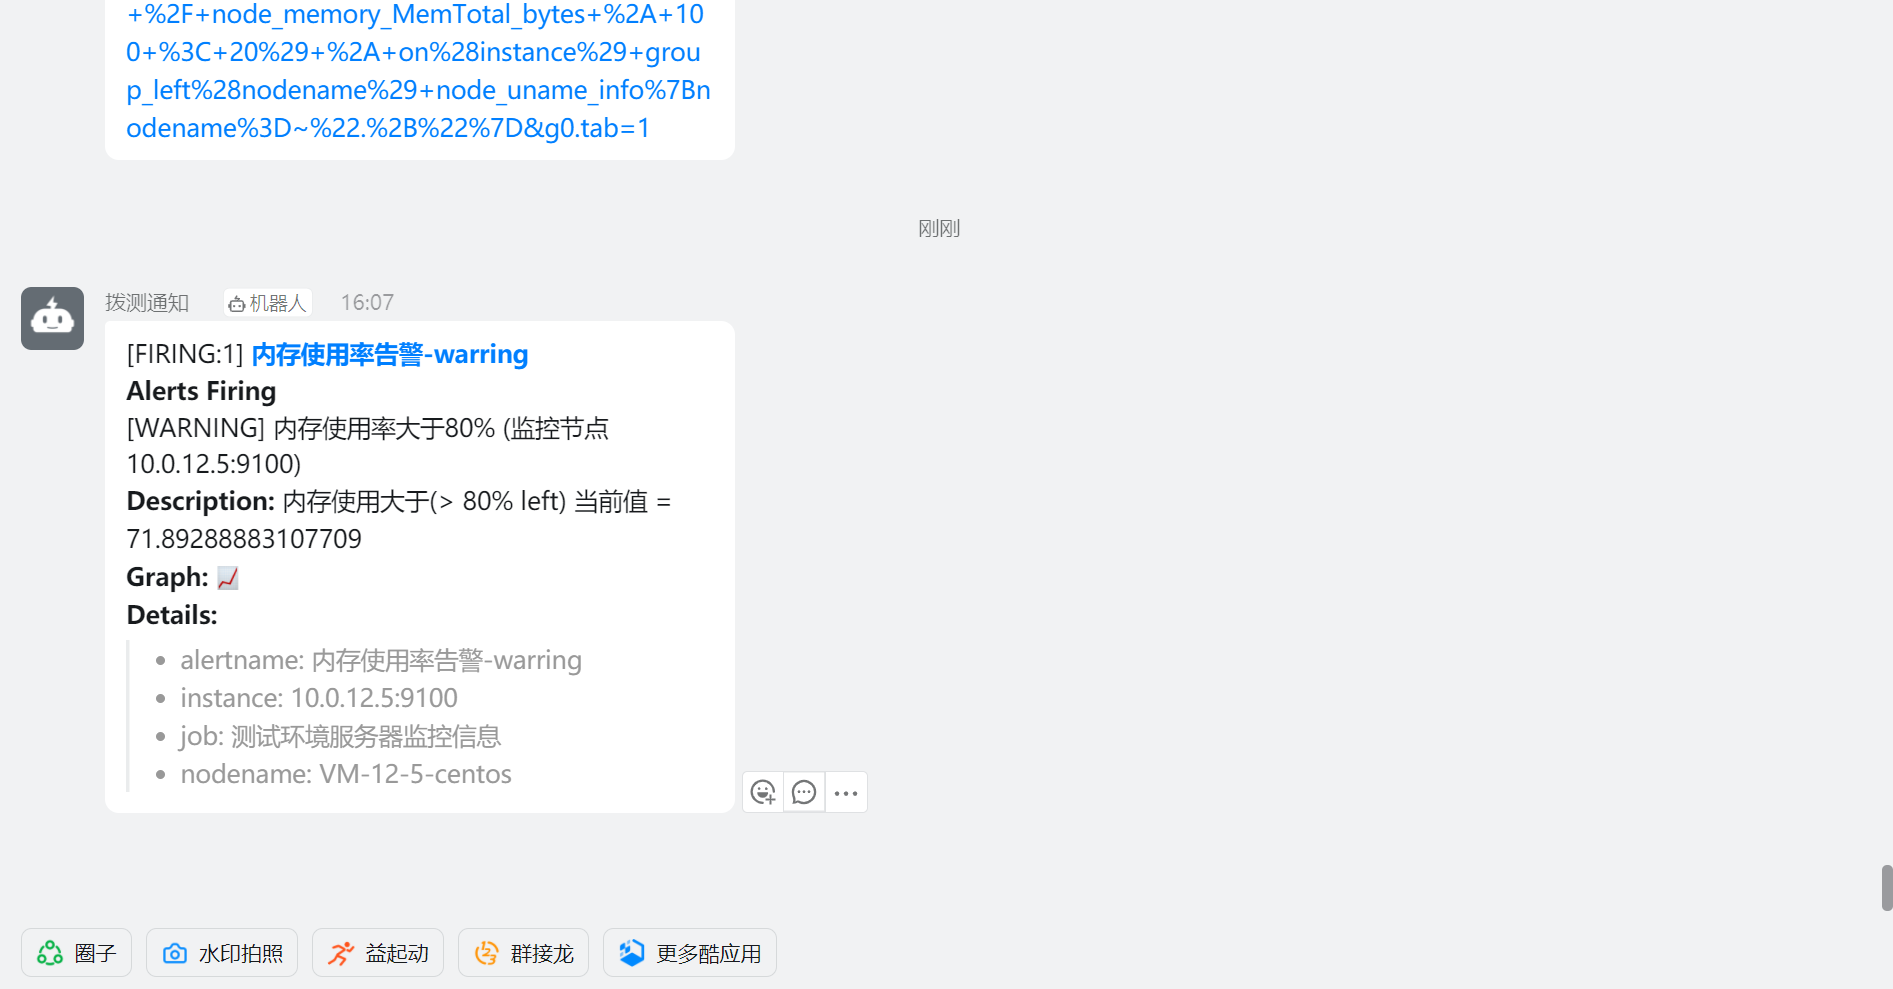
- 报警消息实例
扫描二维码,在手机上阅读