centos7部署Prometheus+Grafana
[TOC]
Prometheus
安装
- 下载二进制安装包
wget "https://install.jishuliu.cn/prometheus/prometheus-2.32.1.linux-amd64.tar.gz"- 解压
tar xf prometheus-2.32.1.linux-amd64.tar.gz -C /usr/local/
cd /usr/local/
mv prometheus-2.32.1.linux-amd64/ prometheus- 配置说明
# 全局配置
global:
  scrape_interval:     15s # 设置抓取间隔,默认为1分钟
  evaluation_interval: 15s #估算规则的默认周期,每15秒计算一次规则。默认1分钟
  # scrape_timeout  #默认抓取超时,默认为10s

# Alertmanager相关配置
alerting:
  alertmanagers:
  - static_configs:
    - targets:
      # - alertmanager:9093

# 规则文件列表,使用'evaluation_interval' 参数去抓取
rule_files:
  # - "first_rules.yml"
  # - "second_rules.yml"

#  抓取配置列表
scrape_configs:
  - job_name: 'prometheus'
    static_configs:
- targets: ['localhost:9090']- 创建prometheus的用户及数据存储目录
useradd  -s /sbin/nologin -M prometheus
mkdir  /usr/local/prometheus/data
chown -R prometheus:prometheus /usr/local/prometheus/
chown -R prometheus:prometheus /usr/local/prometheus/data- 创建Systemd服务启动prometheus
vim /etc/systemd/system/prometheus.service

[Unit]
Description=Prometheus
Documentation=https://prometheus.io/
After=network.target
[Service]
Type=simple
User=prometheus
ExecStart=/usr/local/prometheus/prometheus --config.file=/usr/local/prometheus/prometheus.yml --storage.tsdb.path=/usr/local/prometheus/data
Restart=on-failure
[Install]
WantedBy=multi-user.target- 启动prometheus配置自启动
systemctl start prometheus
systemctl status prometheus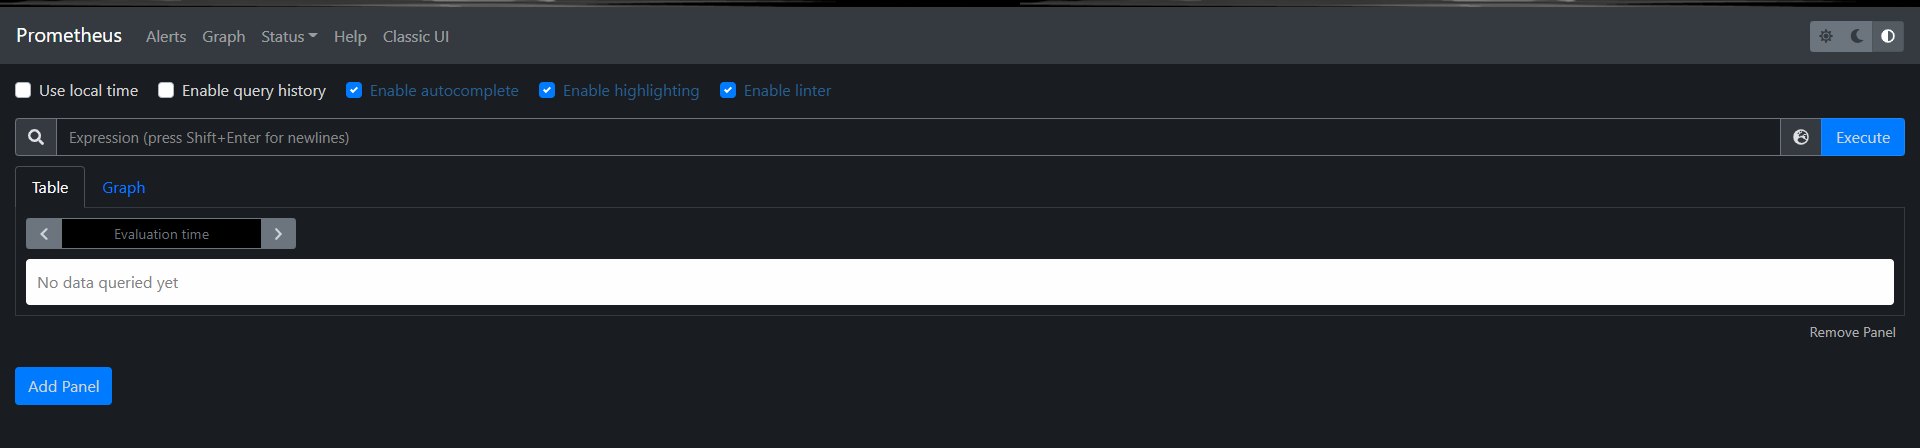
systemctl enable prometheus- 访问服务器IP+9090端口即可看到如下界面
添加Node Exporter
node exporter收集服务器指标
- 本文使用最新的Node Exporter下载地址如下
# 个人服务器地址
https://install.jishuliu.cn/prometheus/node_exporter-1.3.1.linux-amd64.tar.gz
# GitHub下载地址为
https://github.com/prometheus/node_exporter/releases/download/v1.3.1/node_exporter-1.3.1.linux-amd64.tar.gz- 下载最新版的node exporter
wget "https://install.jishuliu.cn/prometheus/node_exporter-1.3.1.linux-amd64.tar.gz"- 安装
tar xf node_exporter-1.3.1.linux-amd64.tar.gz -C /usr/local/
mv node_exporter-1.3.1.linux-amd64/ node_exporter- 使用systemctl或service管理node_exporter
vim /usr/lib/systemd/system/node_exporter.service

[Unit]
Description=node_exporter
After=syslog.target
After=network.target

[Service]
Type=simple
ExecStart=/usr/local/node_exporter/node_exporter
Restart=always
RestartSec=10
StartLimitInterval=100

[Install]
WantedBy=multi-user.target- 启动并设置开机自启
systemctl daemon-reload  # 重新载入配置文件
systemctl start node_exporter  # 启动
systemctl enable node_exporter  # 设置开机自启
systemctl status node_exporter  # 查看运行状态
● node_exporter.service - node_exporter
   Loaded: loaded (/usr/lib/systemd/system/node_exporter.service; enabled; vendor preset: disabled)
   Active: active (running) since Tue 2022-01-04 17:57:00 CST; 59s ago
 Main PID: 30176 (node_exporter)
   CGroup: /system.slice/node_exporter.service
           └─30176 /usr/local/node_exporter/node_exporter

Jan 04 17:57:00 iZ2zeg8k6x4e3osz5lt9wuZ node_exporter[30176]: ts=2022-01-04T09:57:00.343Z caller=node_exporter.go:115 level=info collector=thermal_zone
Jan 04 17:57:00 iZ2zeg8k6x4e3osz5lt9wuZ node_exporter[30176]: ts=2022-01-04T09:57:00.343Z caller=node_exporter.go:115 level=info collector=time
Jan 04 17:57:00 iZ2zeg8k6x4e3osz5lt9wuZ node_exporter[30176]: ts=2022-01-04T09:57:00.343Z caller=node_exporter.go:115 level=info collector=timex
Jan 04 17:57:00 iZ2zeg8k6x4e3osz5lt9wuZ node_exporter[30176]: ts=2022-01-04T09:57:00.343Z caller=node_exporter.go:115 level=info collector=udp_queues
Jan 04 17:57:00 iZ2zeg8k6x4e3osz5lt9wuZ node_exporter[30176]: ts=2022-01-04T09:57:00.343Z caller=node_exporter.go:115 level=info collector=uname
Jan 04 17:57:00 iZ2zeg8k6x4e3osz5lt9wuZ node_exporter[30176]: ts=2022-01-04T09:57:00.343Z caller=node_exporter.go:115 level=info collector=vmstat
Jan 04 17:57:00 iZ2zeg8k6x4e3osz5lt9wuZ node_exporter[30176]: ts=2022-01-04T09:57:00.343Z caller=node_exporter.go:115 level=info collector=xfs
Jan 04 17:57:00 iZ2zeg8k6x4e3osz5lt9wuZ node_exporter[30176]: ts=2022-01-04T09:57:00.343Z caller=node_exporter.go:115 level=info collector=zfs
Jan 04 17:57:00 iZ2zeg8k6x4e3osz5lt9wuZ node_exporter[30176]: ts=2022-01-04T09:57:00.343Z caller=node_exporter.go:199 level=info msg="Listening on" address=:9100
Jan 04 17:57:00 iZ2zeg8k6x4e3osz5lt9wuZ node_exporter[30176]: ts=2022-01-04T09:57:00.343Z caller=tls_config.go:195 level=info msg="TLS is disabled." http2=false
添加MySQL exporter
mysql exporter收集mysql指标
- 下载mysqld_exporter
官网下载地址:https://prometheus.io/download/#mysqld_exporter
个人源下载地址:https://install.jishuliu.cn/prometheus/mysqld_exporter-0.14.0.linux-amd64.tar.gz- 在被监控的数据库内创建用户并授权
# 连接数据库
mysql -u 用户名 -p 密码
    # 创建一个mysql_monitor的用户并设置密码为123、连接地址为localhost
    grant select,replication client, process on *.* to 'mysql_monitor'@'localhost' identified by '123';
    # 刷新权限信息
flush privileges;- 把下载好的mysqld_exporter上传到服务器
# 解压压缩包
tar xf mysqld_exporter-0.14.0.linux-amd64.tar.gz
mv mysqld_exporter-0.14.0.linux-amd64/ mysqld_expoeorter
# 进入目录
cd mysqld_exporter
# 新增.my.cnf文件并写入以下内容,user为连接数据库的用户名,password为密码
    [client]
    user=mysql_monitor
password=123- 把mysqld_exporter注册成服务
# 在/usr/lib/systemd/system/目录下新增mysqld_exporter.service文件并写入以下内容
[Unit]
Description=mysqld_exporter
After=syslog.target
After=network.target

[Service]
Type=simple
# /usr/local/mysqld_exporter/mysqld_exporter为解压路径下的mysqld_exporter可执行文件的绝对路径
# --config.my-cnf为存储mysql账号密码的文件的绝对路径
ExecStart=/usr/local/mysqld_exporter/mysqld_exporter --config.my-cnf=/usr/local/mysqld_exporter/.my.cnf
Restart=always
RestartSec=10
StartLimitInterval=100

[Install]
WantedBy=multi-user.target- 启动mysqld_exporter并设置开机自启
systemctl daemon-reload
service mysqld_exporter start
systemctl enable mysqld_exporter
Prometheus添加数据源
- 在 prometheus.yml 中配置 node_exporter 的metrics 端点,内容如下:
  - job_name: 'linux-exporter'
    metrics_path: /metrics
    static_configs:
    - targets: ['172.25.34.51:9100'] # node_exporter
- targets: ['172.25.34.51:9104'] # mysqld_exporter- 重启Prometheus
systemctl restart prometheus- 访问 Prometheus可以看到如下界面

Grafana
- 下载安装包
wget "https://install.jishuliu.cn/grafana/grafana-enterprise-8.3.3-1.x86_64.rpm"
- 安装
sudo yum install grafana-enterprise-8.3.3-1.x86_64.rpm- 修改配置文件的数据库连接内容
[database]
# You can configure the database connection by specifying type, host, name, user and password
# as separate properties or as on string using the url properties.

# Either "mysql", "postgres" or "sqlite3", it's your choice
type = mysql
host = 127.0.0.1:3306
name = grafana
user = root
# If the password contains # or ; you have to wrap it with triple quotes. Ex """#password;"""
password = 123456- 创建数据库并授权
# 登录mysql命令行
mysql -uroot -p123456
# 创建数据库
create database grafana default character set utf8;
# 删除用户及权限
drop user grafana@'localhost';
# 创建用户
create user grafana@'localhost' IDENTIFIED by '123456';
# 设置权限
GRANT ALL ON grafana.* TO grafana@'localhost' WITH GRANT option;
# 刷新权限
flush PRIVILEGES;- 安装额外字体
yum install fontconfig freetype* urw-fonts -y- 启动服务
systemctl status grafana-server   # 查看服务状态
systemctl start grafana-server   # 启动服务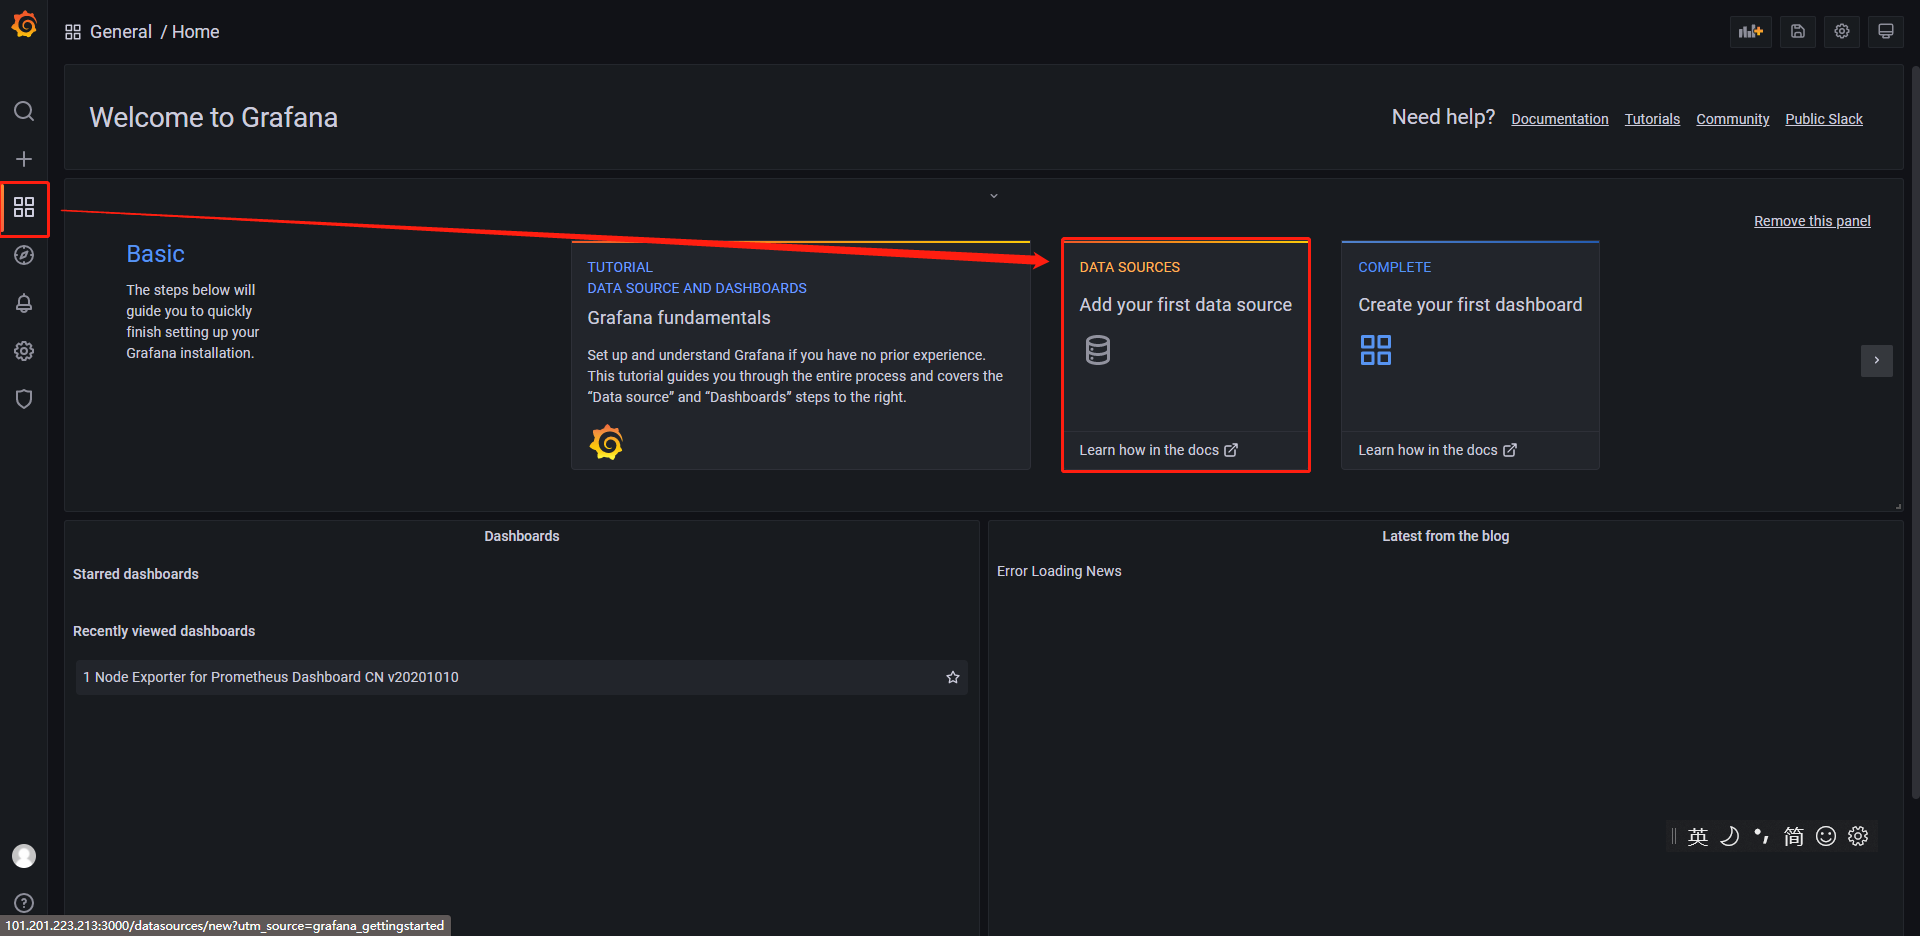
systemctl enable grafana-server # 开机自启动- 访问grafana首页,默认密码是admin、admin,访问地址为IP+3030
添加数据源
- 1:添加数据源
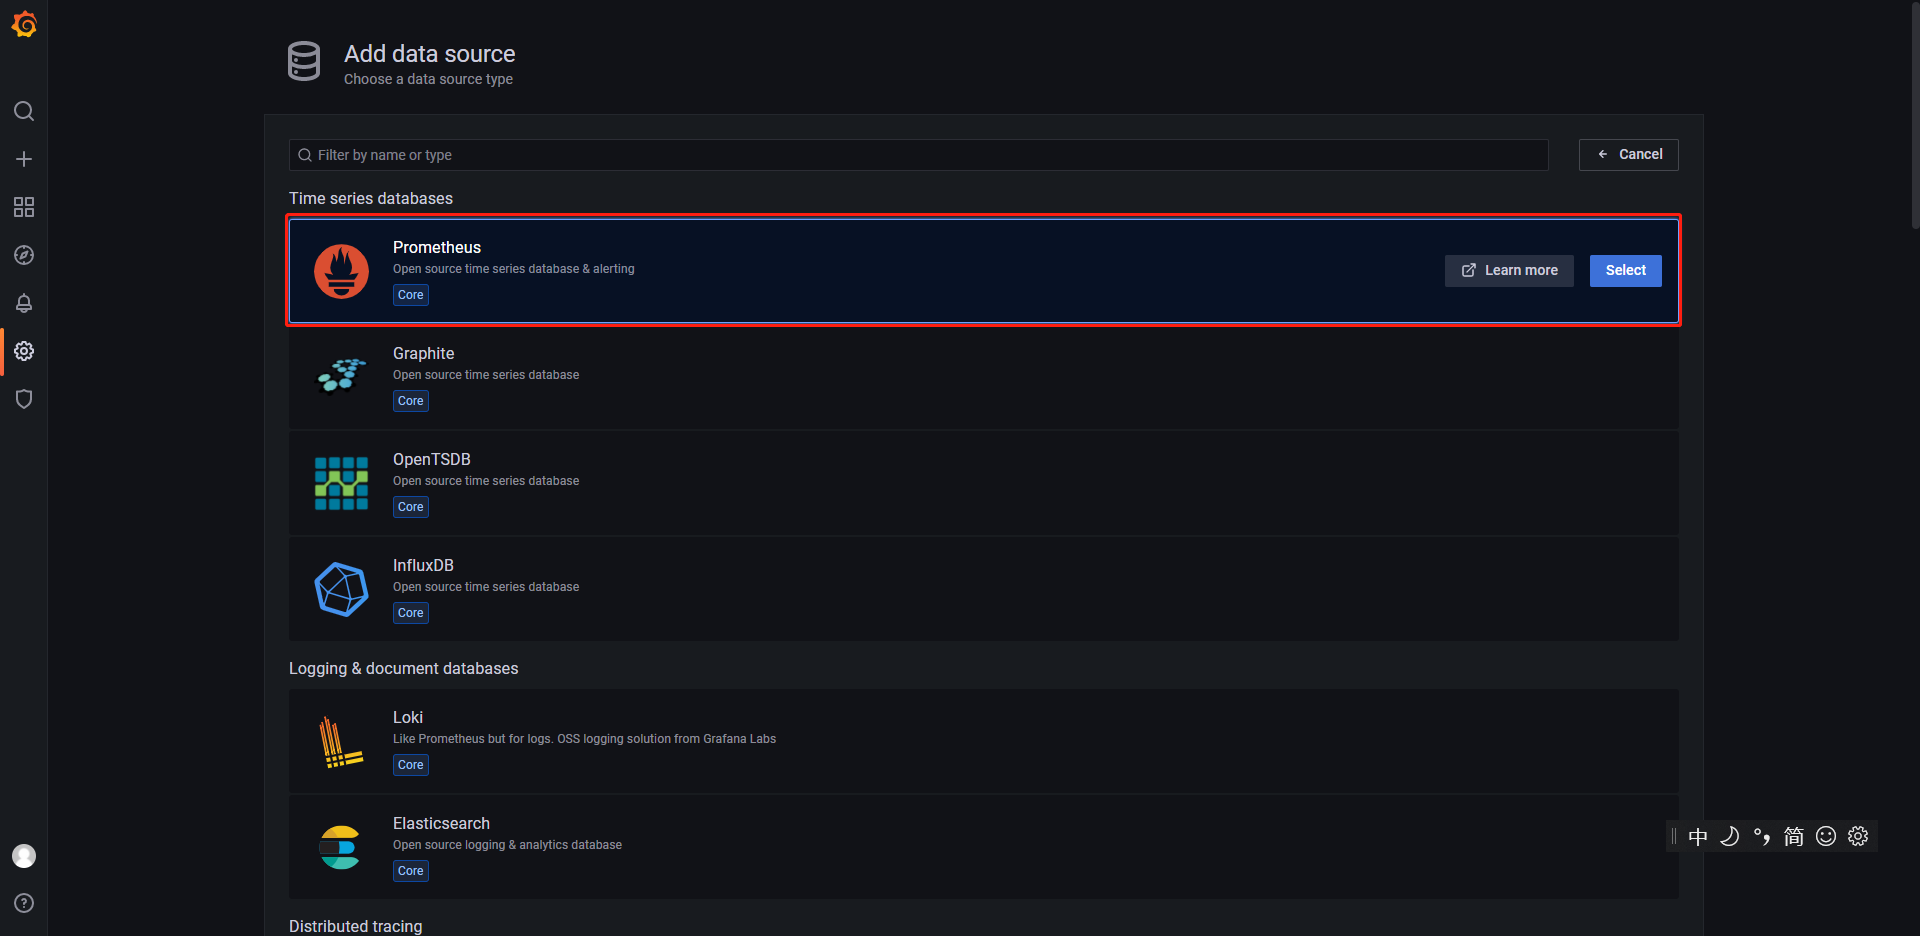
- 2:选择Prometheus
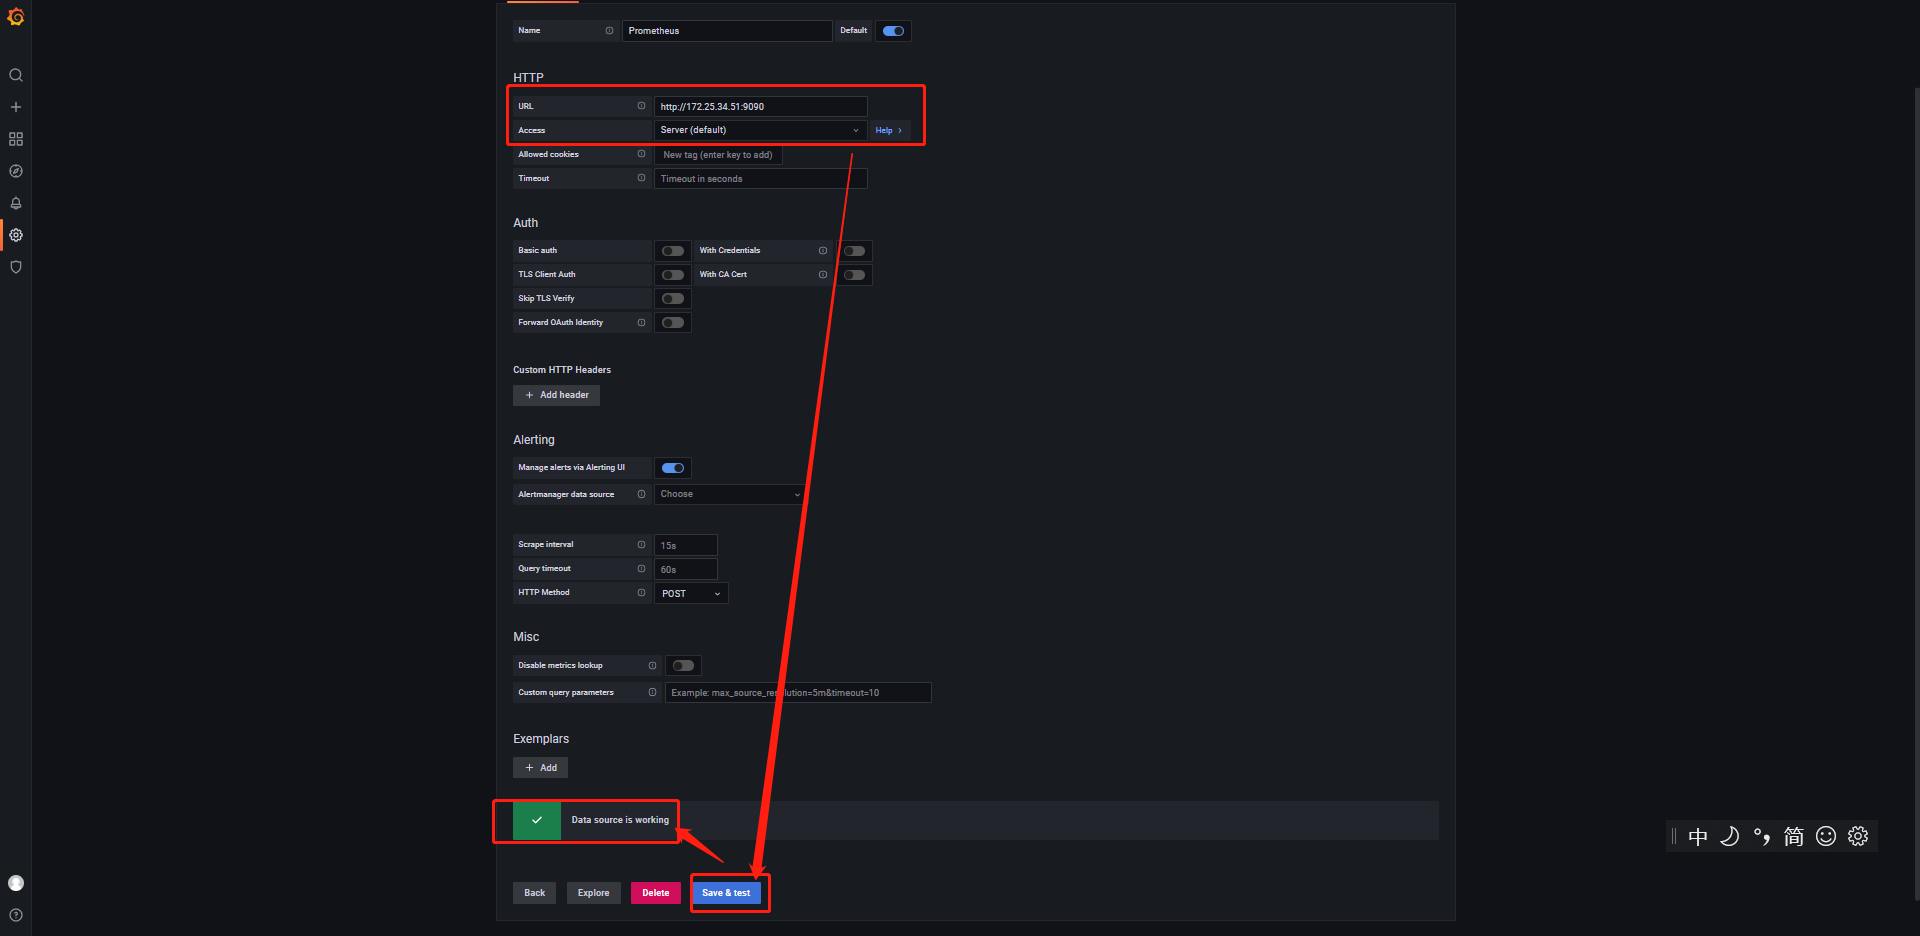
- 3:输入数据源信息并测试连通性
添加Dashboard
node_exporter
-
在本文中使用的为Node Exporter的中文面板,下载地址为
# 个人服务器地址 "http://kodbox.jishuliu.cn/?explorer/share/fileDownload&shareID=75qriMgg&path=%7BshareItemLink%3A75qriMgg%7D%2Fgrafana%2Fnode-exporter-for-prometheus-dashboard-cn-v20201010_rev24.json&s=OJAtb" # 官方地址 https://grafana.com/api/dashboards/8919/revisions/24/download -
1:在添加Dashboard时选择导入
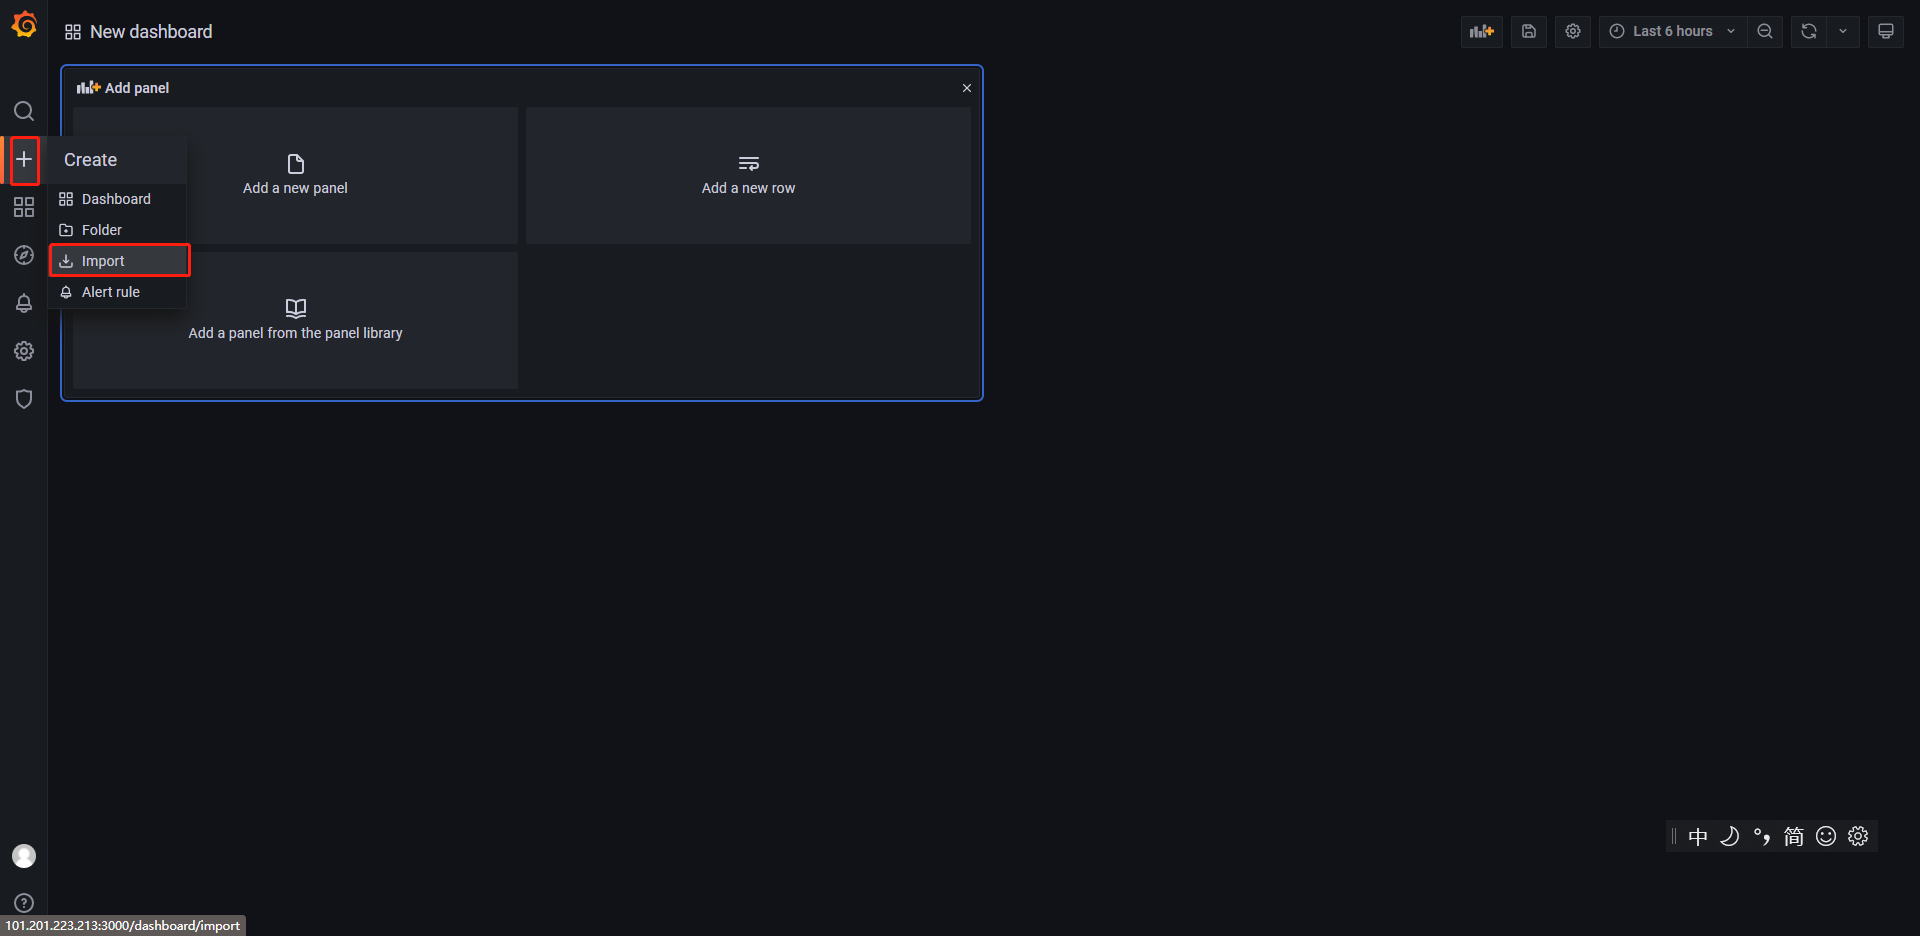
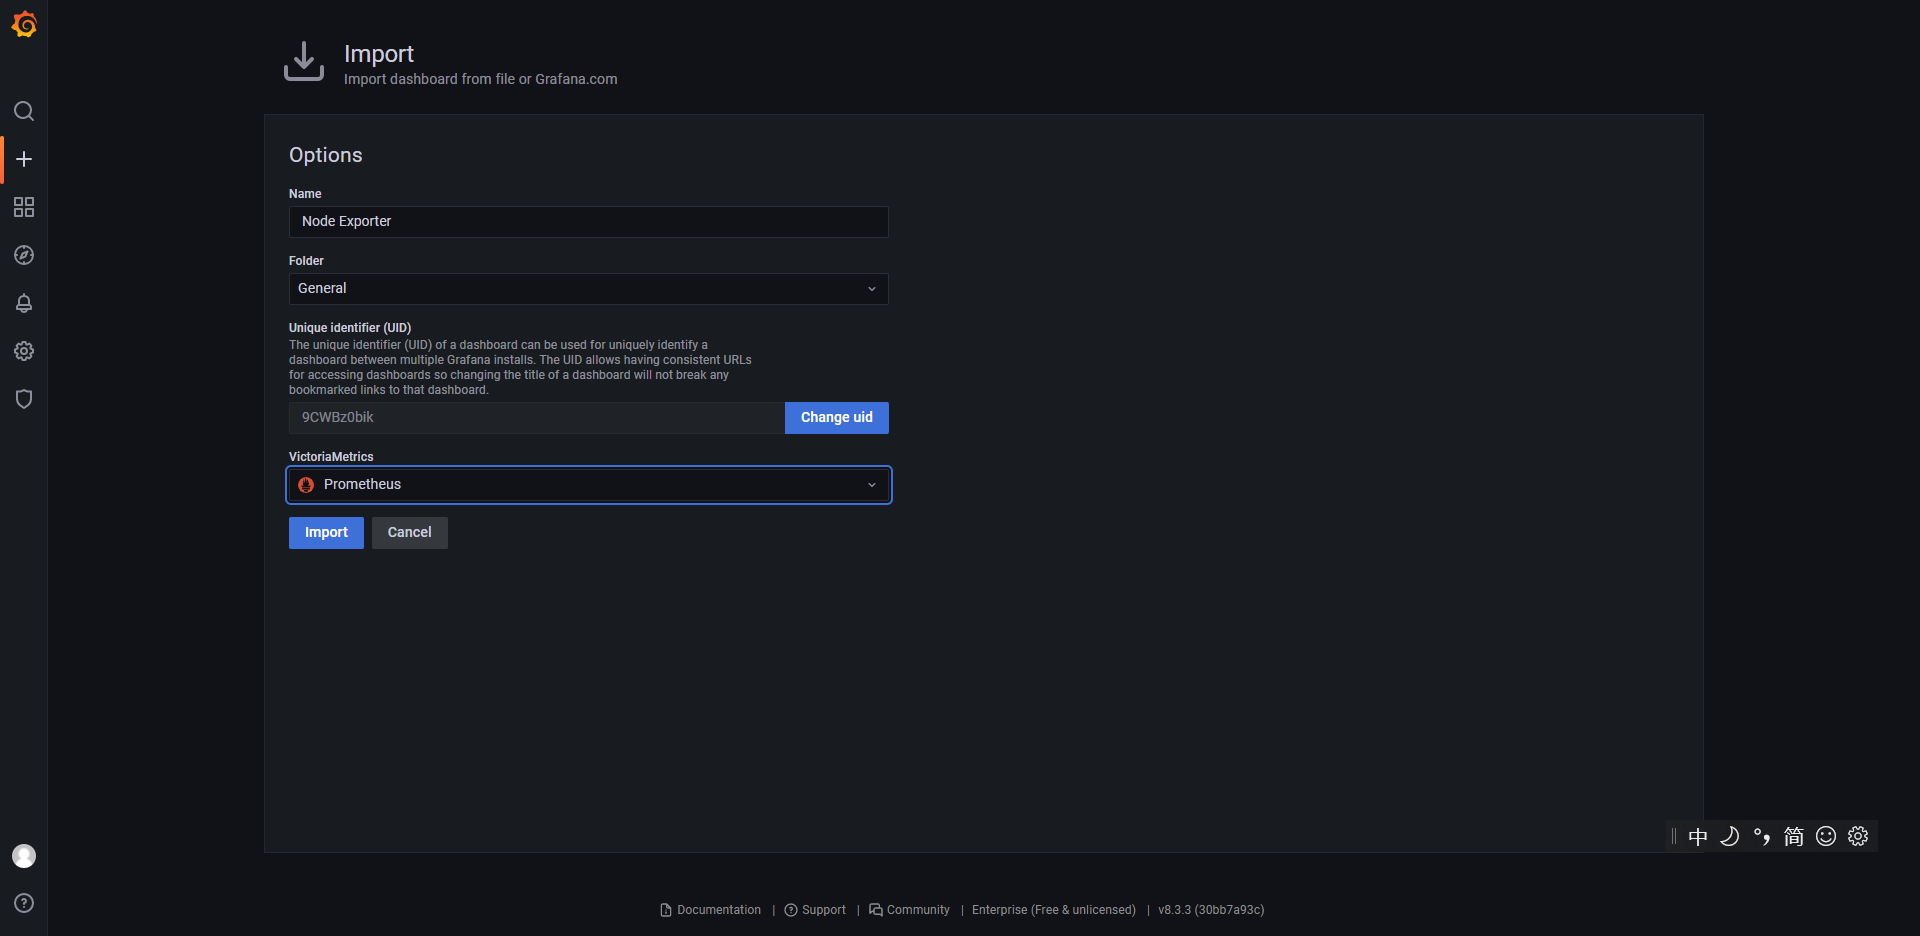
- 2:选择upload json file并导入node-exporter-for-prometheus-dashboard-cn-v20201010_rev24.json文件并选择Prometheus为数据源
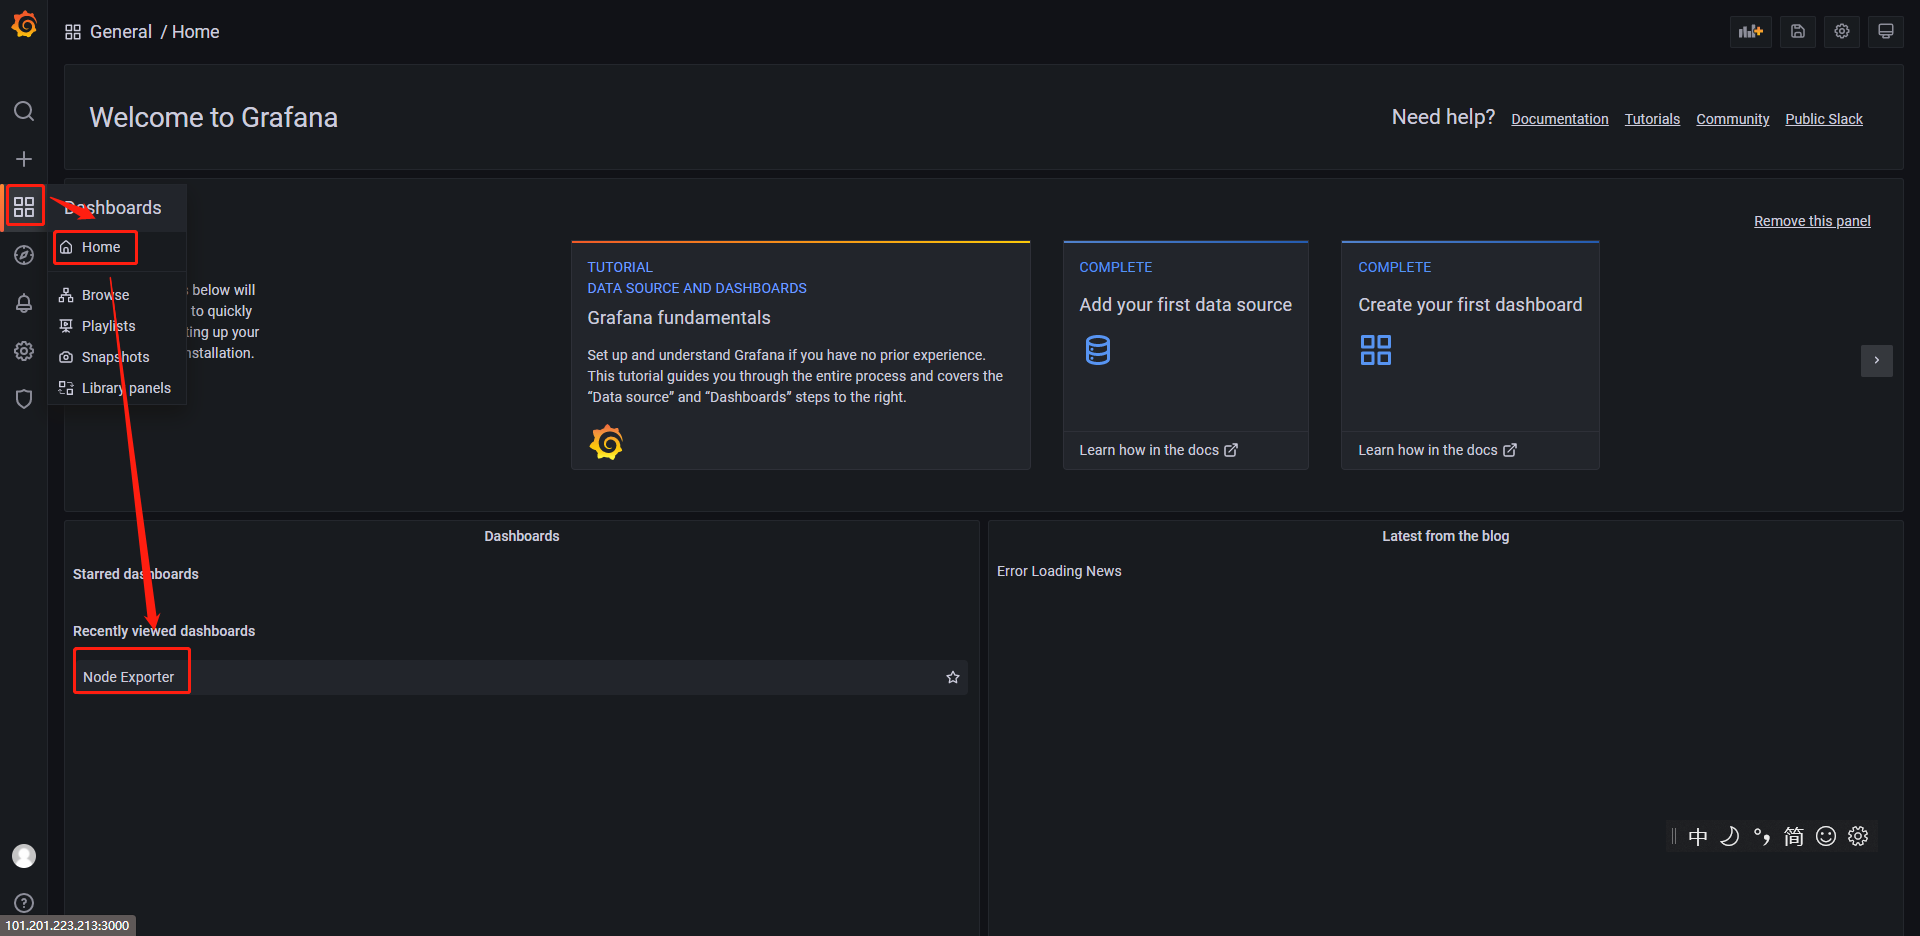
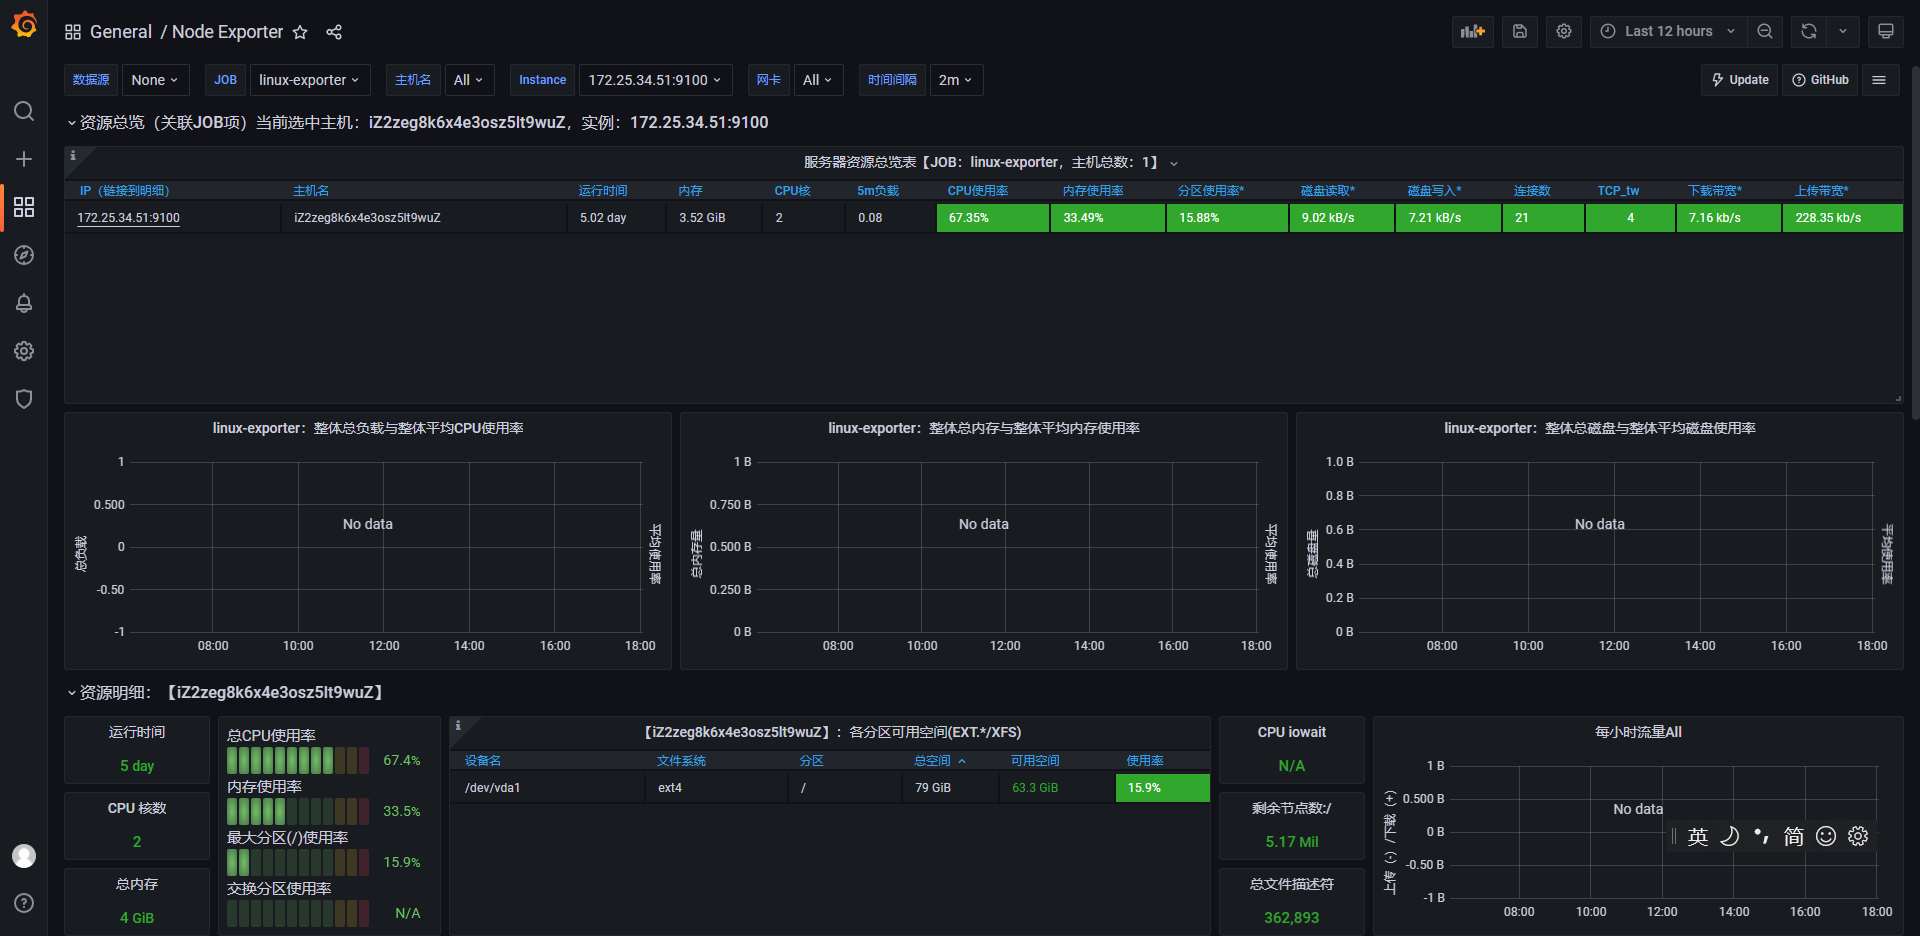
- 3:在Dashboard首页查看刚才添加的面板
mysqld_exporter
- 使用percona公司的模板
官网下载地址:https://grafana.com/grafana/dashboards/7362-mysql-overview/
个人下载地址:https://install.jishuliu.cn/grafana/mysql-overview_rev5.json- 在添加Dashboard时选择导入

- 选择upload json file并导入mysql-overview_rev5.json,数据源为Prometheus

- 查看导入后的Dashboard

扫描二维码,在手机上阅读
版权所有:小破站
文章标题:centos7部署Prometheus+Grafana
文章链接:https://www.jishuliu.cn/?post=17
本站文章均为原创,未经授权请勿用于任何商业用途
文章标题:centos7部署Prometheus+Grafana
文章链接:https://www.jishuliu.cn/?post=17
本站文章均为原创,未经授权请勿用于任何商业用途